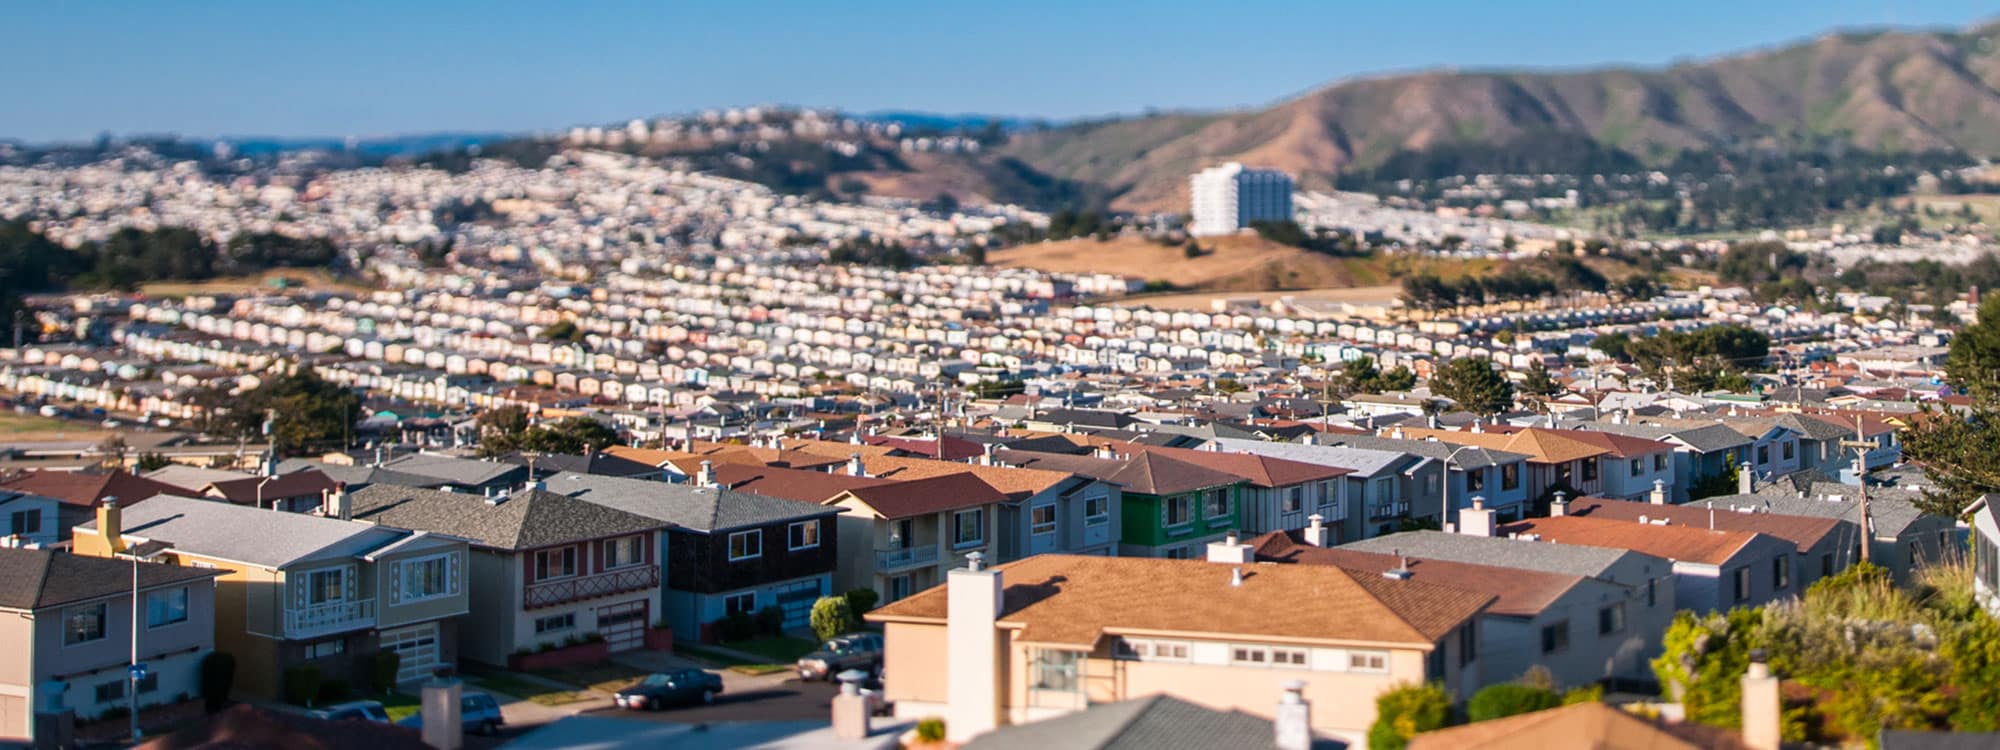
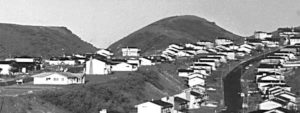
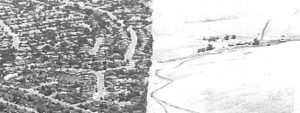
Sprawl development is the outward expansion of low-density residential and commercial development into the outer edges of cities and towns, far from downtown areas.
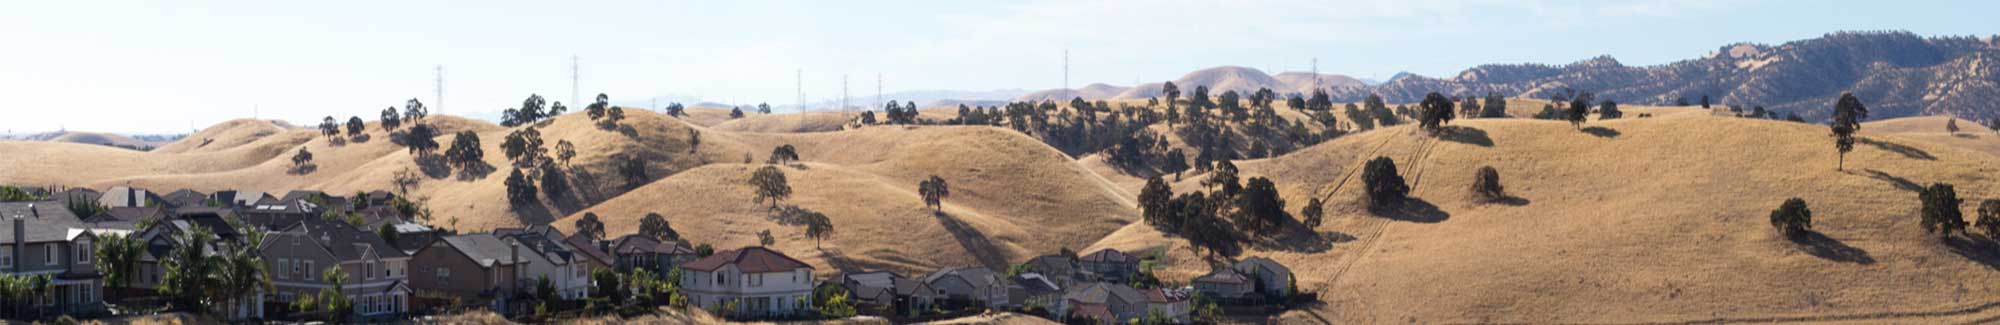
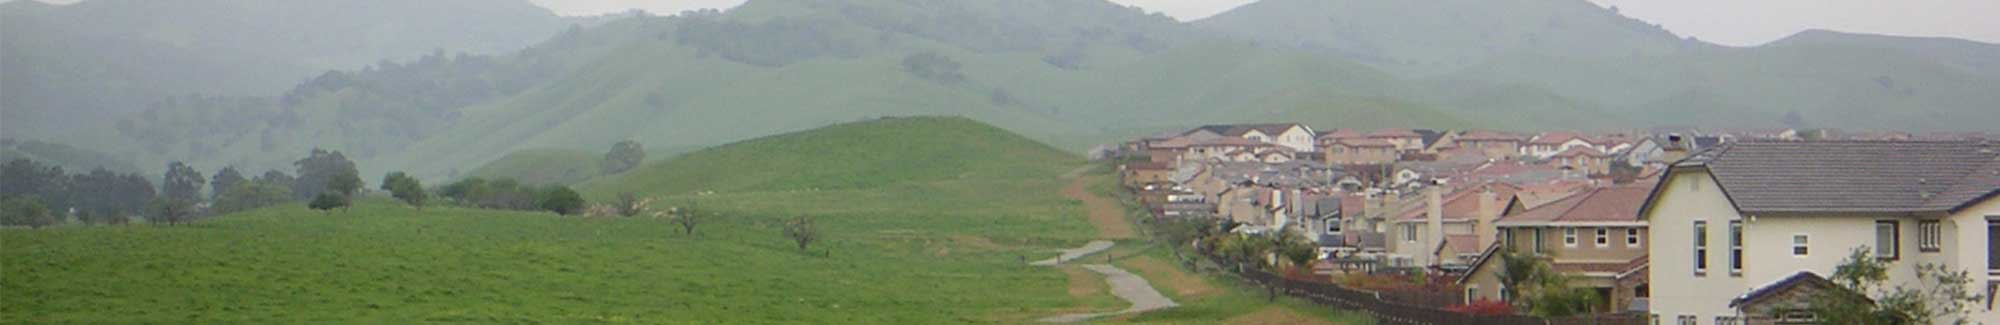
Over the last several decades, sprawl has expanded Bay Area cities and suburbs onto natural and agricultural lands. In turn, this sprawling development degrades, reduces, and ultimately destroys the greenbelt areas that surround our cities and towns, which provide critical ecosystems and resources to the entire region. Learn more about what a greenbelt is here.
What Are the Impacts of Sprawl Development?
Sprawl development impacts cities in many ways, ranging from transportation to community development. When a city expands onto the undeveloped land beyond it, it results in economic, environmental, health, and climate consequences.
Economic Costs
Multiple studies show that low-density sprawl burdens local governments with higher economic costs in the long run compared to “infill” development—development on vacant or underused land within areas that are already largely developed.. Sprawling outward requires that new roads, water mains, sewer pipes, and other infrastructure be extended into undeveloped land outside of cities and towns (which constitute “the greenbelt”), while infill development usually requires simpler, less costly upgrades to existing city infrastructure.
Economic costs can include:
- Providing water, sewer, roads, and other services to far-flung neighborhoods, which is very costly for local governments. A 2015 study by the Global Commission on the Economy and Climate found that policies limiting density in large cities cost America over $1 trillion, and can increase per-capita land consumption by up to 80% and car use by up to 60%.
- Higher transportation and energy costs, and reduced access to jobs, services, and amenities in more centralized locations. These additional costs can outweigh the typically-reduced housing prices that residents may pay to live in outlying areas.
- Residents in sprawl neighborhoods can expect to drive about three times as many miles as urban drivers, who rely more heavily on walking, biking, and public transit. In addition, the estimated yearly cost to provide roads in the most sprawled communities averaged $804.74 per household, compared to $19.87 in the highest-density communities. And a 2012 San Francisco State University study found a 10% increase in dense development and smart growth amenities—including increases in housing density, jobs per capita and public transit infrastructure—resulting in a 20% decrease in vehicle miles traveled.
- More expensive public services than infill development.
- For example, a new development on the outskirts of a city requires new police and fire services. Because sprawl development is more distant and less dense, more officers may need to be working at a time to cover the additional area.
- Regarding fire services, the further a home is from a fire station, the higher its property insurance rates are in order to address a low fire rating. A Charlotte, North Carolina study in 2012 found that neighborhoods with low densities and disconnected streets require four times the number of fire stations at four times the cost compared with more compact and connected neighborhoods.
- Similarly, the costs of other municipal services also rise as sprawl increases. Denser communities pay less to provide infrastructure and services including water, roads, solid waste, libraries, parks and recreation, governance, and more. The “Cost of Sprawl” analysis found that a city’s annual average household cost for public services is $1,416 in high-density areas, and up to a whopping $3,462 in sprawling areas (as of 2012).
Environmental Costs
- Sprawl development leads to more cars driving more miles, thus creating more traffic delays, pollution, and safety risks. Decades of traffic data shows that building or expanding roads to serve new or existing sprawl only increases congestion through “induced demand.” Adding road capacity encourages people to take longer or more frequent car trips. For example, a $1 billion infrastructure investment in 2012 to widen I-405 in Los Angeles resulted in commute times that averaged one minute longer than before the widening.
- A 2019 traffic study by INRIX found that drivers in the San Francisco metro area lose an average of 116 hours each year in traffic congestion. That’s almost 5 days a year sitting in traffic! This congestion costs individual drivers in the Bay Area $1,624 per year, and it costs the region itself $3.4 billion per year.
- Sprawl development uses more water. As lot sizes increase, water consumption increases as well, largely due to the increased irrigation demand. Denser developments are typically more water-efficient than a single-family house with a green lawn. A 2015 report from Energy Innovation and Calthorpe Associates found annual per-capita water use almost doubled from 25,000 gallons in “urban” development to 44,000 gallons in “standard” (sprawl) development.
- Natural and agricultural lands catch and filter rain, replenishing groundwater supplies. But if these lands are paved over, they cannot collect water. This is especially important in areas that rely on groundwater for drinking.
- There are 2.5 million acres of land that are important for wildlife—habitat, corridors, and biodiversity. For example, Coyote Valley is considered a hot spot for biodiversity, containing a variety of habitats that support a wide range of plants and animals. In some cases, the plants and animals are unique to this area.
Health Costs
- Numerous studies have shown how sprawl negatively affects our health. Cities built around car use provide fewer opportunities to exercise than walkable and bikeable cities.
- Cars and trucks release air pollutants, including ozone, CO2, and airborne particulates, which are a known cause of respiratory problems such as asthma and lung cancer.
- Studies have linked increased vehicle miles traveled (VMT) to rising obesity rates, diabetes, chronic illness, inactivity, and mental health impacts. People living in less walkable communities have a 50% higher rate of diabetes as compared to the most walkable communities. The exercise that residents of walkable neighborhoods get daily is an important public health benefit of higher density development.
- In addition, a 2014 study found that sprawl is associated with significantly higher direct and indirect effects on the rate of fatal vehicle crashes. The direct effect is likely due to the higher traffic speeds in sprawling areas, and the indirect effect is due to greater vehicle miles driven in such areas.
Climate Change
- The latest report from the United Nations Intergovernmental Panel on Climate Change (IPCC) states that cities cover less than 1% of the world’s surface, but generate about 75% of the global total carbon emissions from energy use. It also found that urban sprawl could consume as much as 5% of current cultivated land by 2050—in other words, five times the current footprint of cities themselves.
- As noted above, low-density sprawl development results in a significant increase in vehicle miles travelled compared to infill development. This increase in VMT produces a commensurate increase in vehicle greenhouse gas (GHG) emissions. The EPA has estimated that 29% of all GHG emissions in 2017 came from the transportation sector, which now leads power generation as the largest GHG-emitting sector of the economy. This means that, even as the Bay Area regional and California state economies move towards greater reliance on renewable energy sources for electricity and industrial production, climate change emission targets will not be met without substantial reductions in GHG emissions from the transportation sector.
- Bay Area ecosystems, especially forests and wetlands, are very efficient at storing the greenhouse gas, carbon. Together, the region’s at-risk landscapes store more than 6 million metric tons of carbon. If continued sprawl develops these lands, the carbon that would be released is equivalent to putting 1.3 million cars on the road every year.
Preventing Sprawl Development
With extensive studies and reports leading to the conclusion that sprawl has many negative impacts, the question remains: why are developers still building sprawl? An article in The Atlantic delves further into this question. And our At Risk: The Bay Area Greenbelt report is the definitive research on the farms, ranches, and natural areas at risk of being lost forever to sprawl development.
Greenbelt Alliance stands against sprawl in the Bay Area. Through continued campaigning for urban growth boundaries and the promotion of infill development that revitalizes existing downtowns, we became the first Bay Area environmental group to shift the focus to not just preventing bad development, but also encouraging the right development in the right places. Read more about our mission, history, and how we work.
You can help!
There are several ways you can prevent sprawl and support smart growth in the Bay Area. Take action now to tell decision-makers that you won’t stand for sprawl.
Get Updates
Get monthly updates on smart growth and conservation in the Bay Area.
Photo: Daniel Hoherd via Flickr