Our Approach to Resilience Hotspots
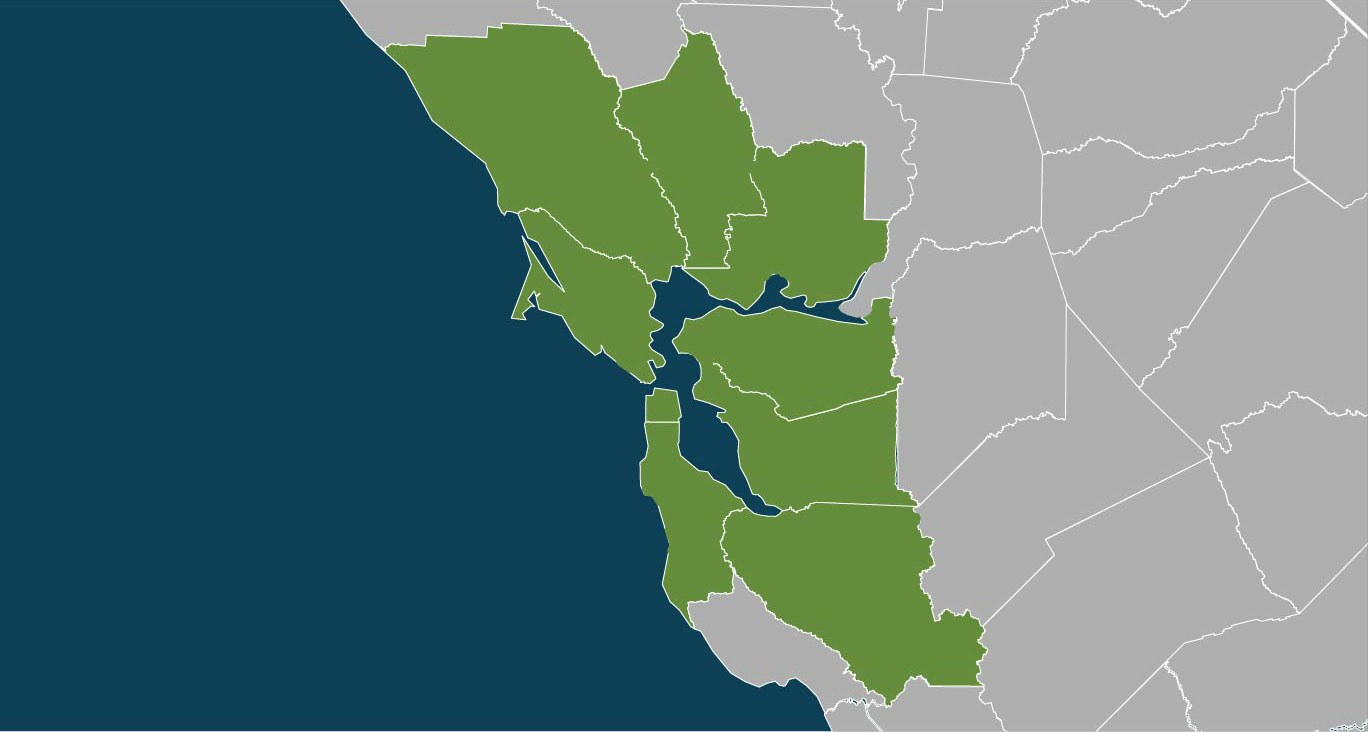
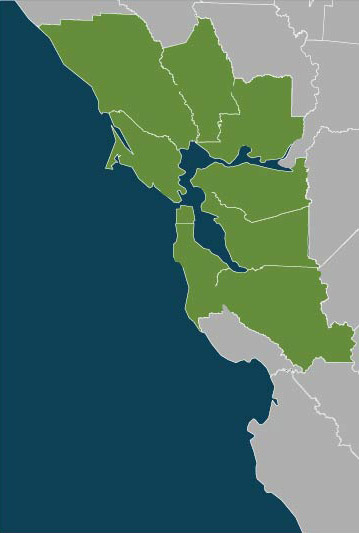
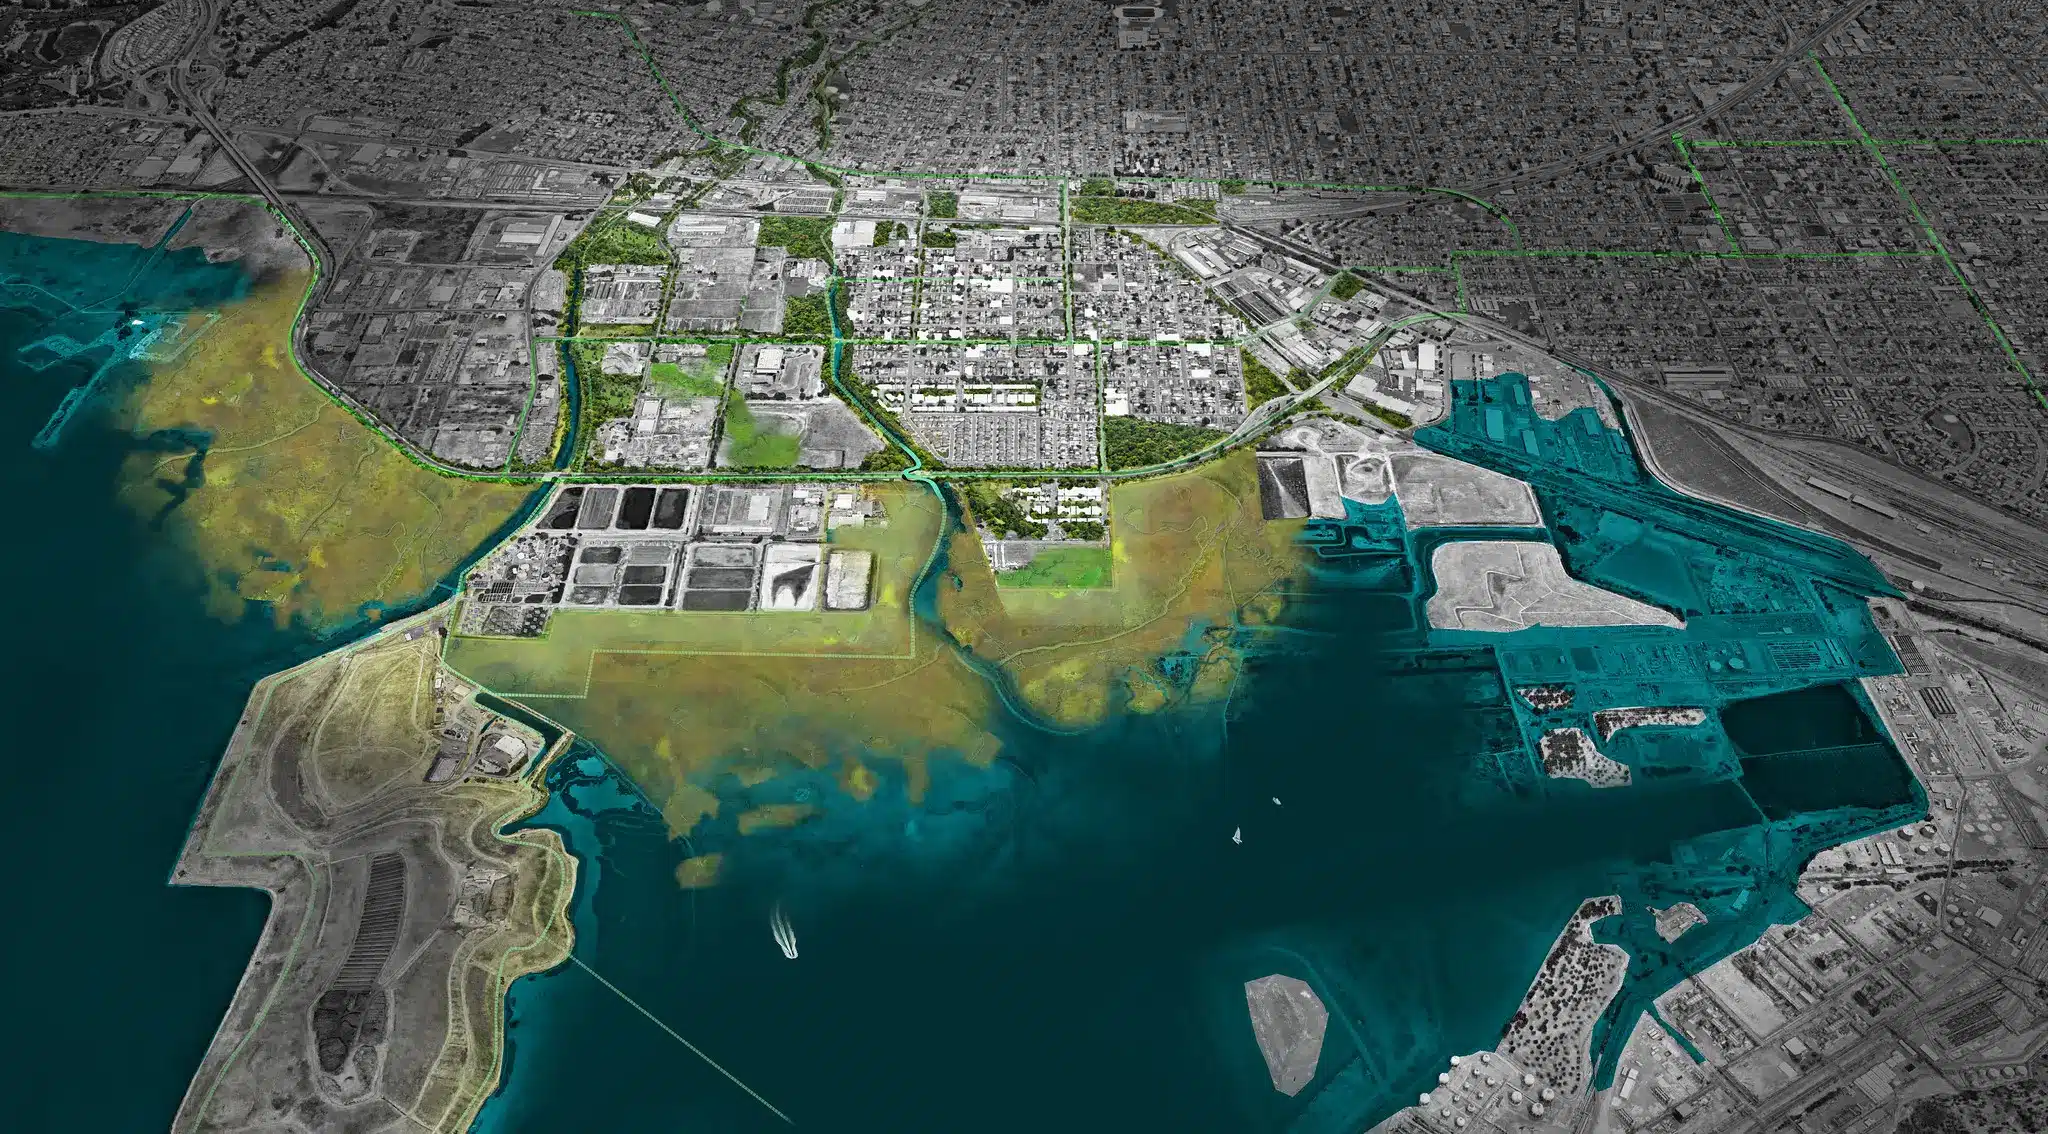
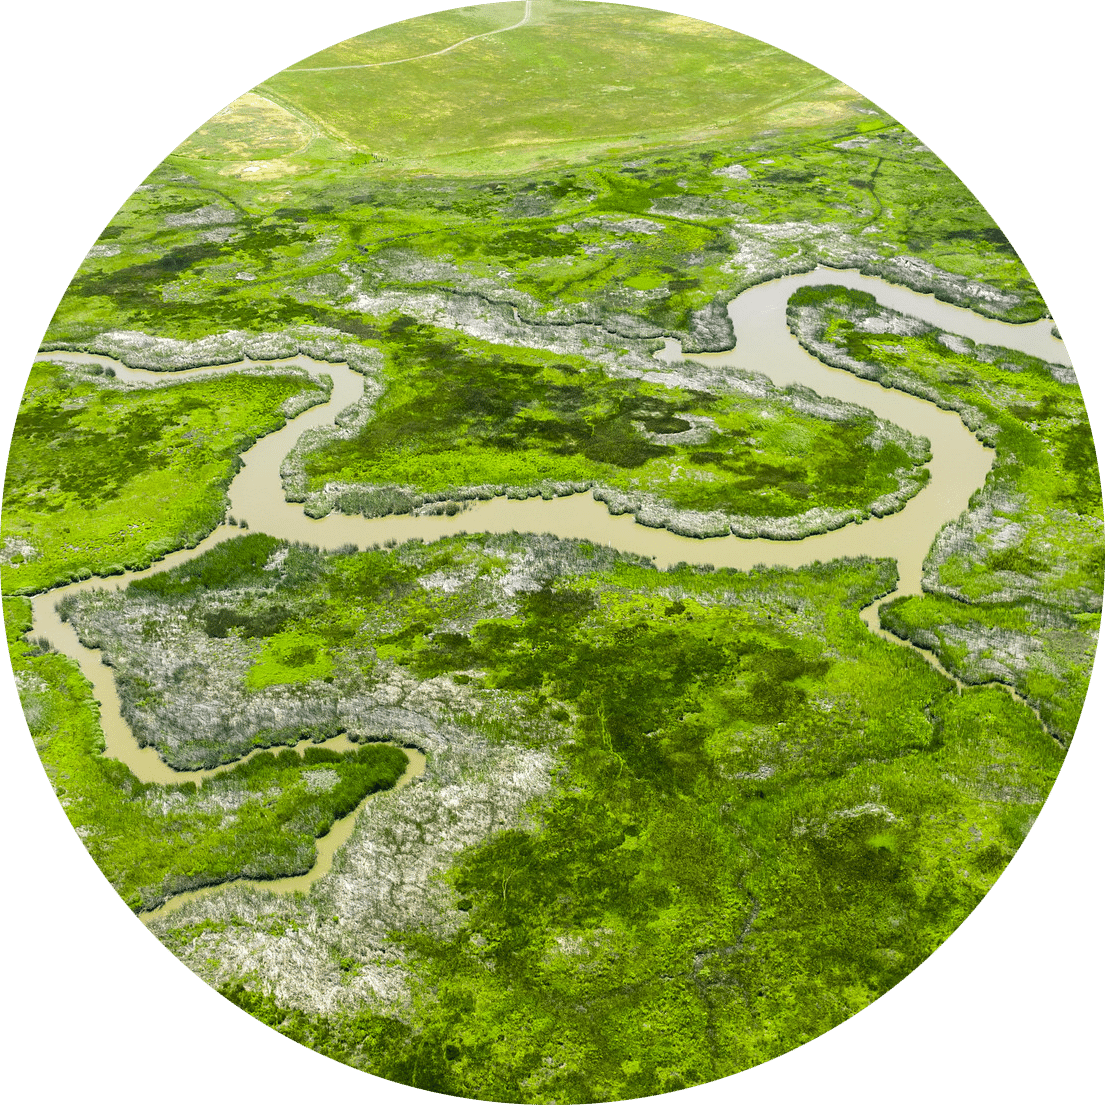
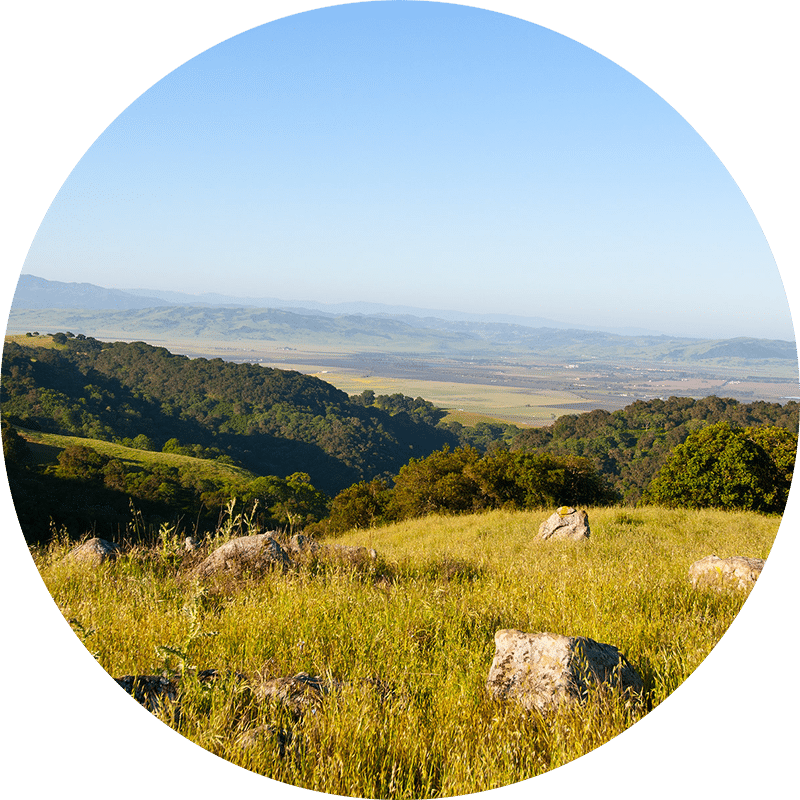
Across the Bay Area, there is a need for prioritizing nature-based climate resilience projects to protect those most vulnerable to climate change—in ways that have multiple benefits to habitat, open space, biodiversity, recreation, and more. Greenbelt Alliance has identified Resilience Hotspots throughout the Bay Area where lands and communities are at greatest risk of wildfire, flooding, and extreme heat. This effort leverages rich datasets and collaboration with local partners to validate that data in order to craft powerful climate solutions.
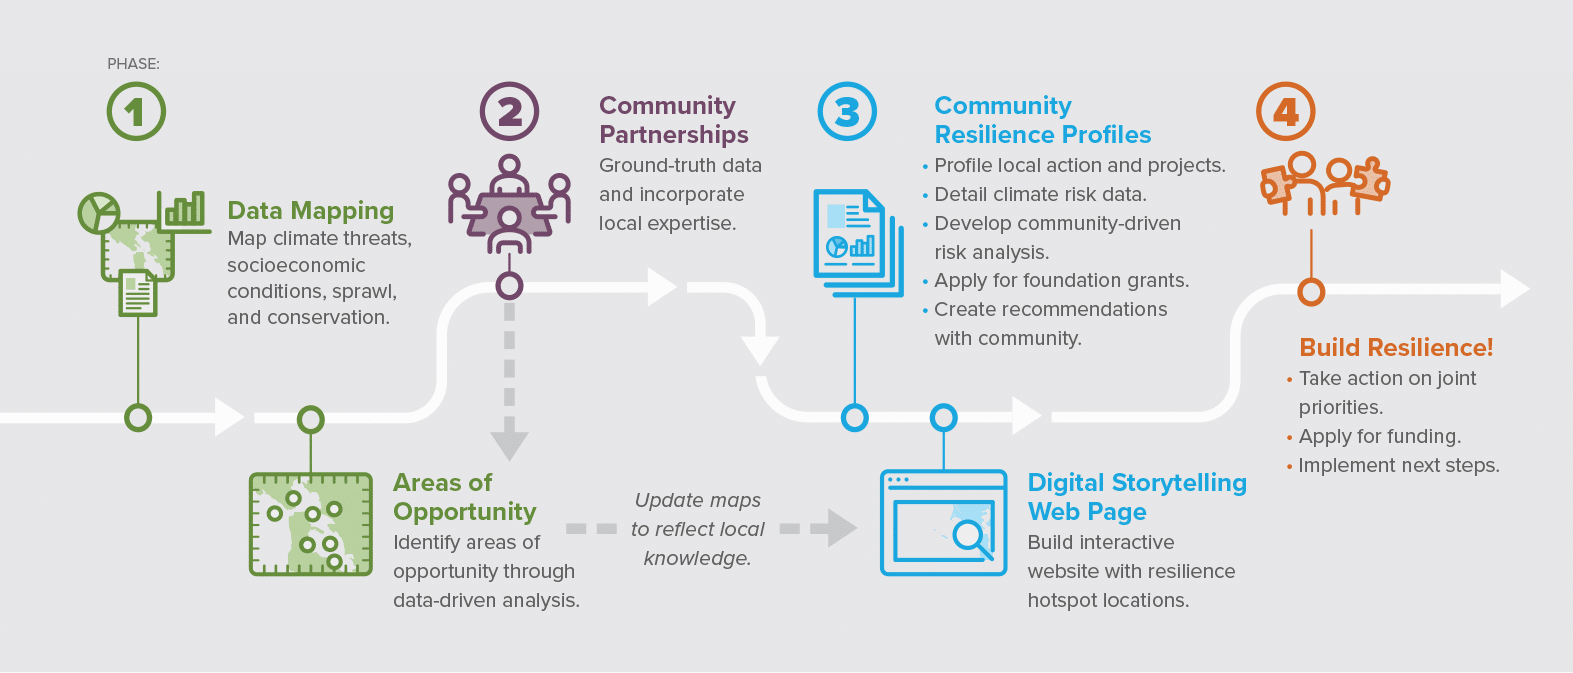
Through a robust spatial analysis process, Greenbelt Alliance compiled regional spatial data to identify opportunities for nature-based solutions that can address climate risks. This work was informed by incorporating data layers that speak to physical features of a place like climate and sprawl risk as well as socioeconomic factors that can make some populations more vulnerable to climate hazards, including income, education, accessibility, race and ethnicity, health, and housing. At the core of this work is an effort to balance climate hazards, social vulnerability factors, and conservation priorities into actionable map outputs that are paired with our partners’ work, research, and local priorities necessary to advance on-the-ground projects. This data and spatial analysis process was informed by a diverse group of technical advisors who reviewed the data and methodology and provided feedback on best practices. Learn more about the specific datasets used in this analysis by downloading the Technical Memo below.
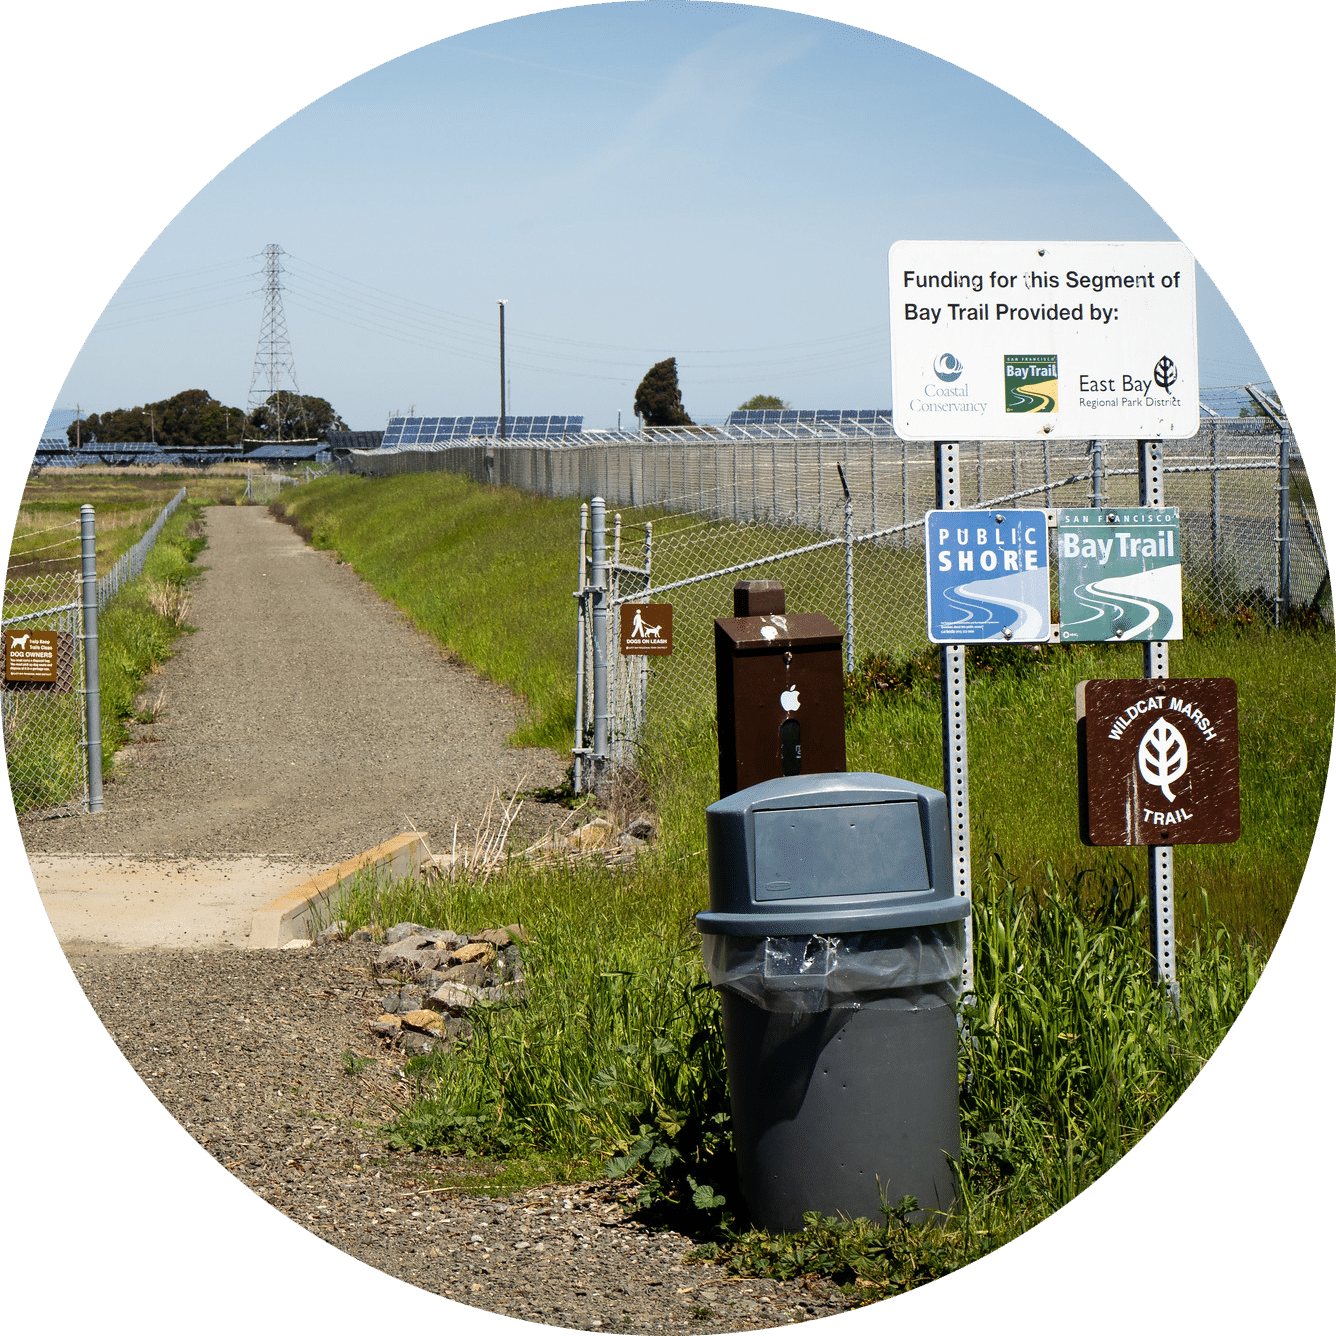
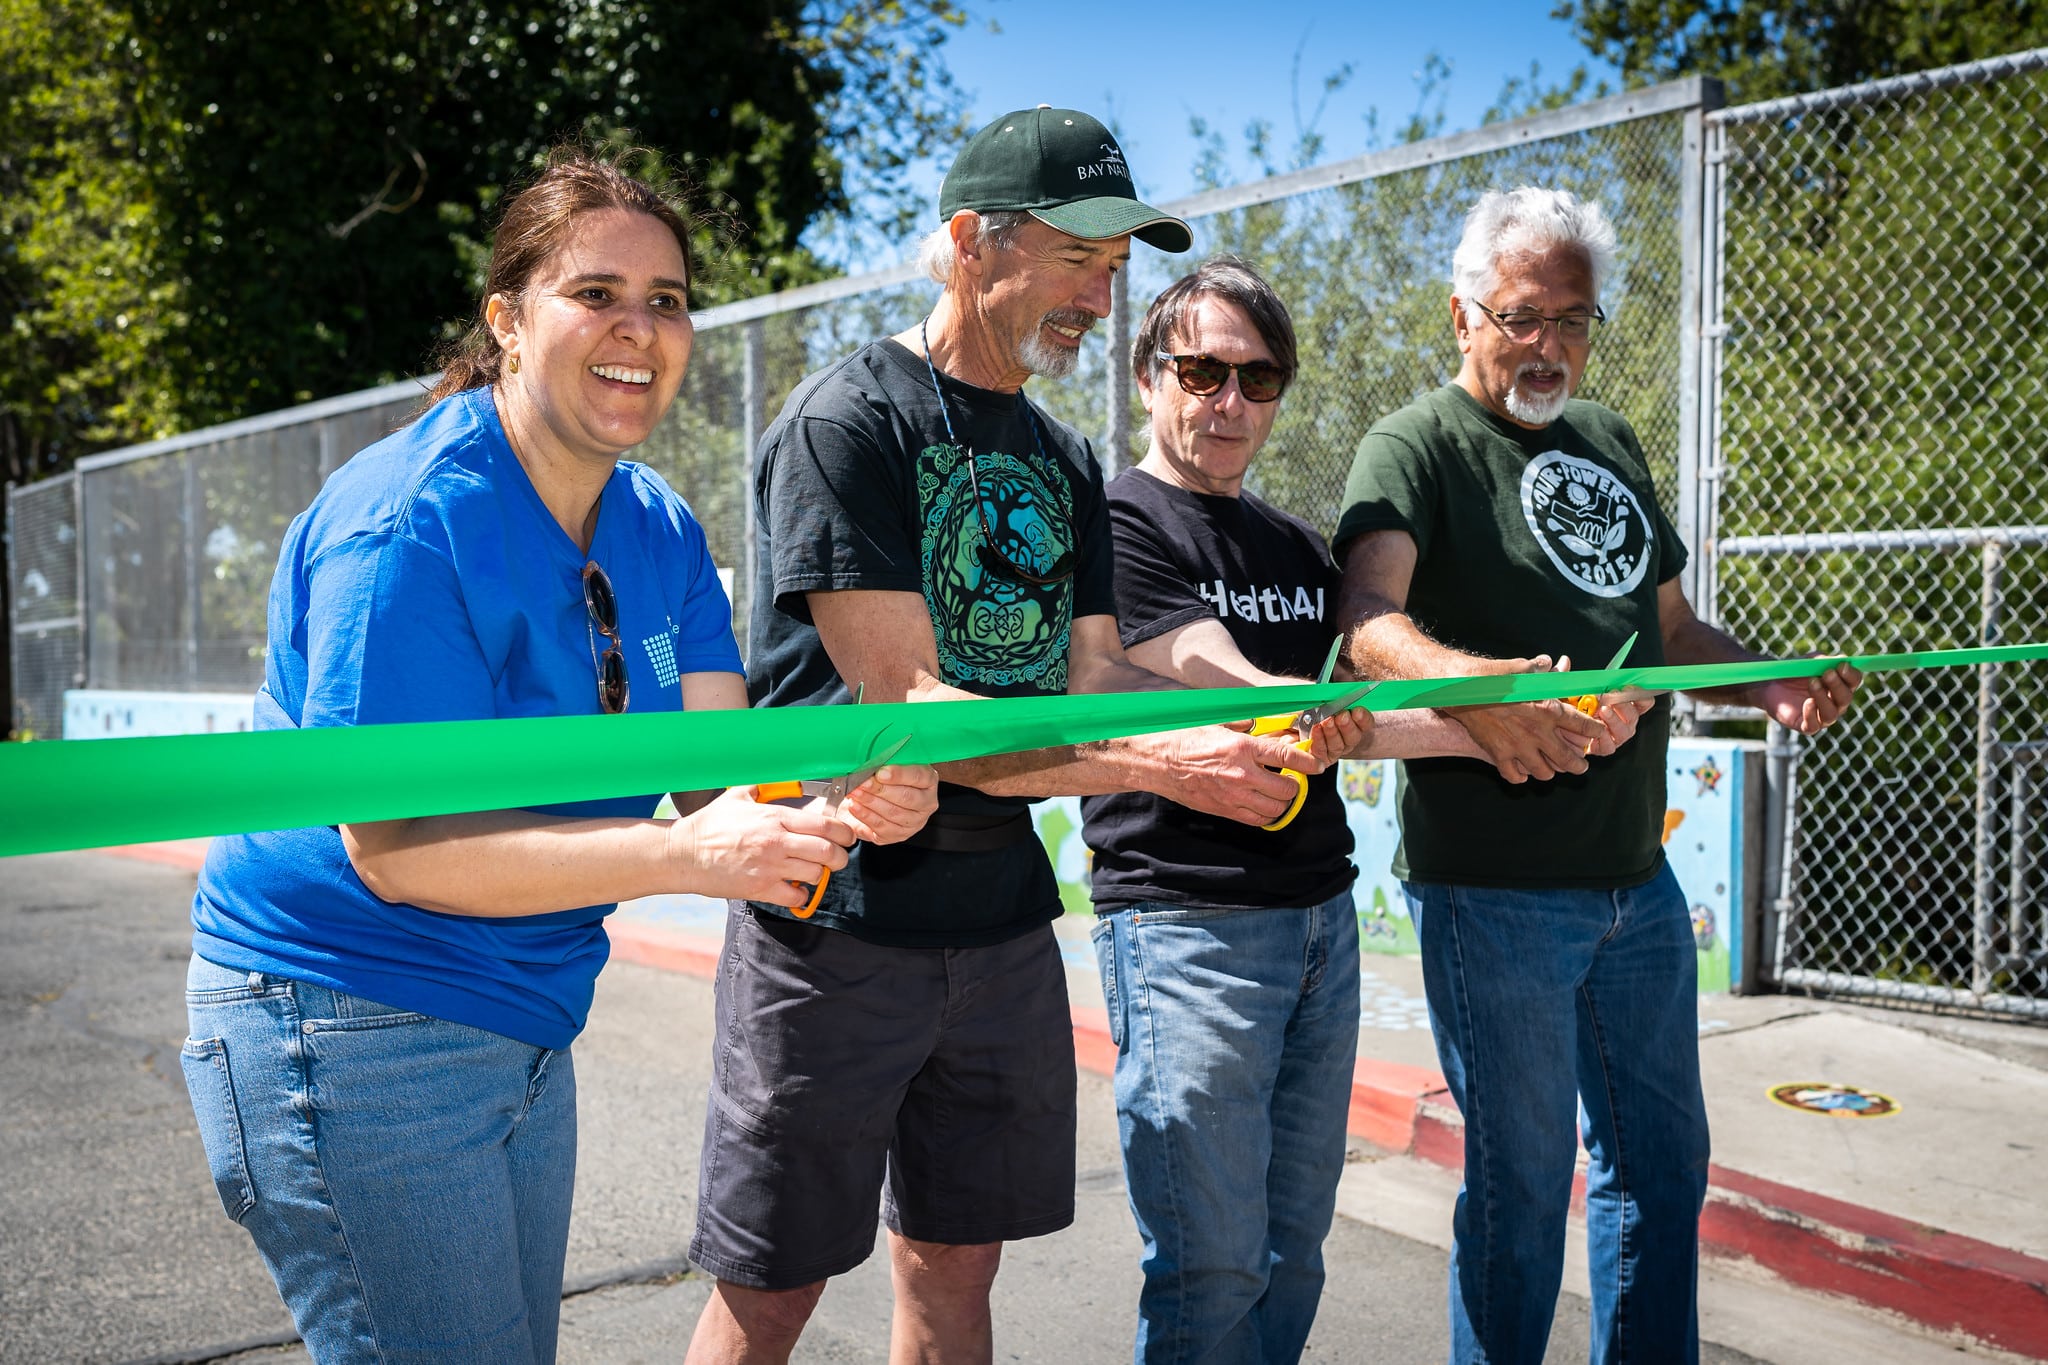
The maps created during this spatial analysis process pointed us toward locations where we partnered with local leaders to understand the context and local lived experiences in communities so that we could properly interpret what the data was showing. The result of this process is the Community Resilience Profiles, co-produced for Southwest Santa Rosa, Gilroy, North Richmond, Suisun, and Newark. Local relationship-building was pivotal to this work and a process we look forward to completing in all Hotspots as resources become available.
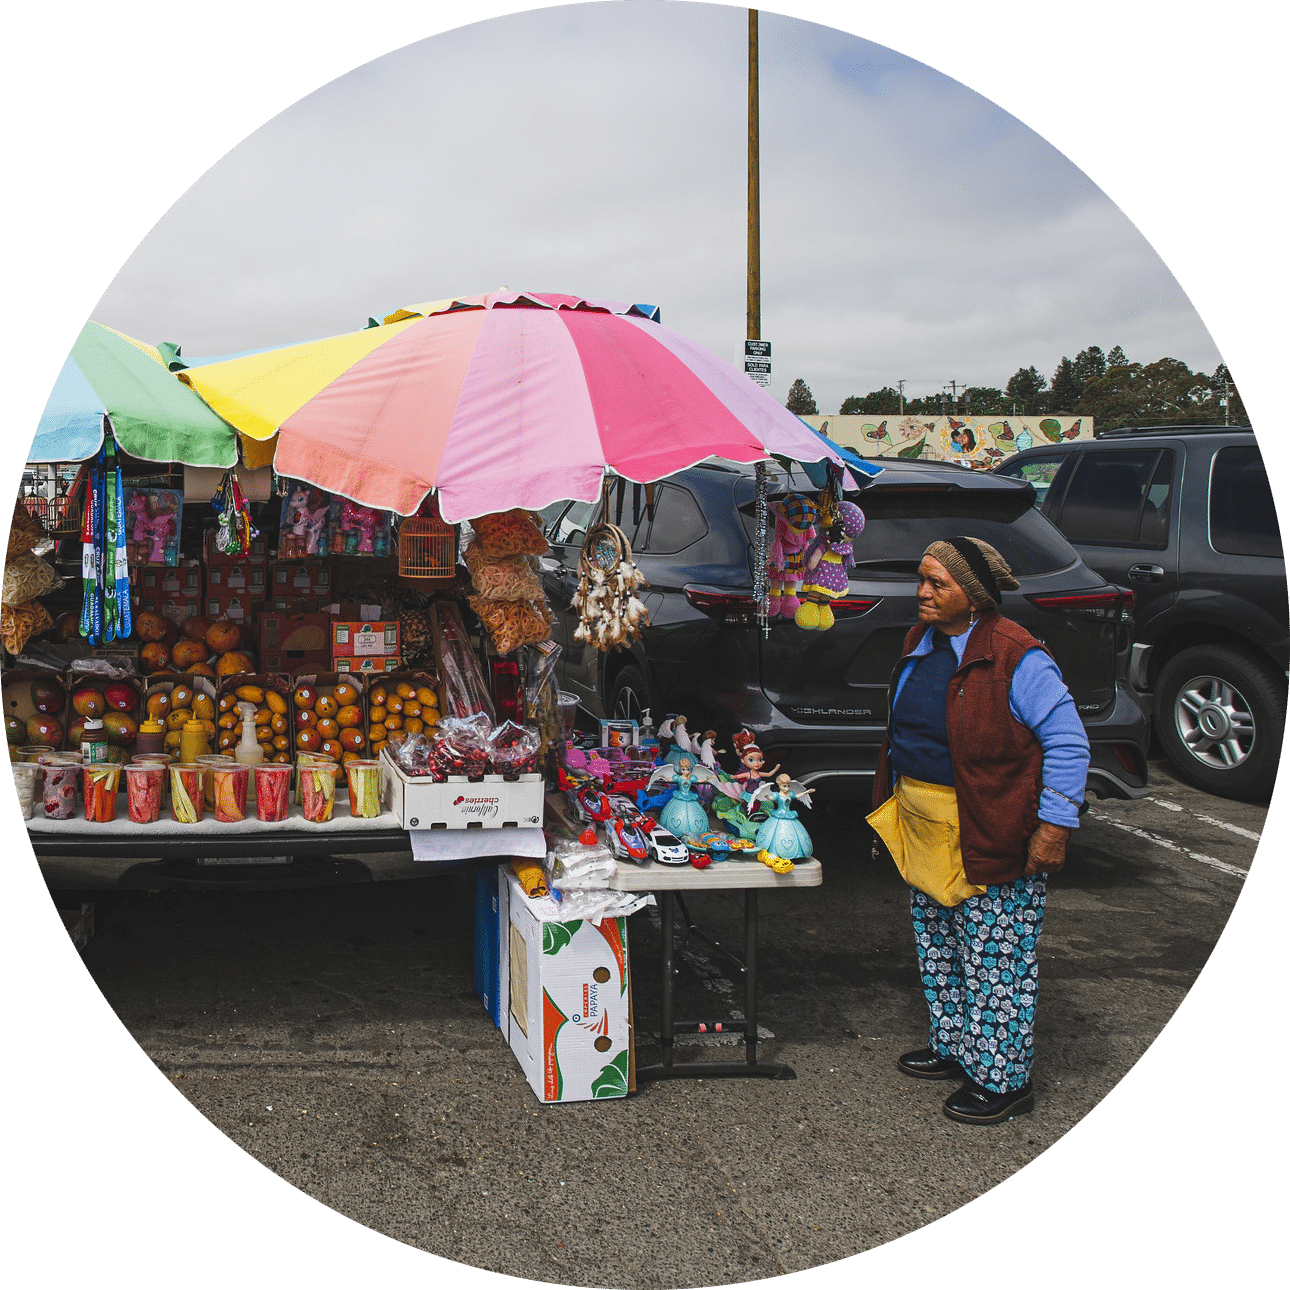
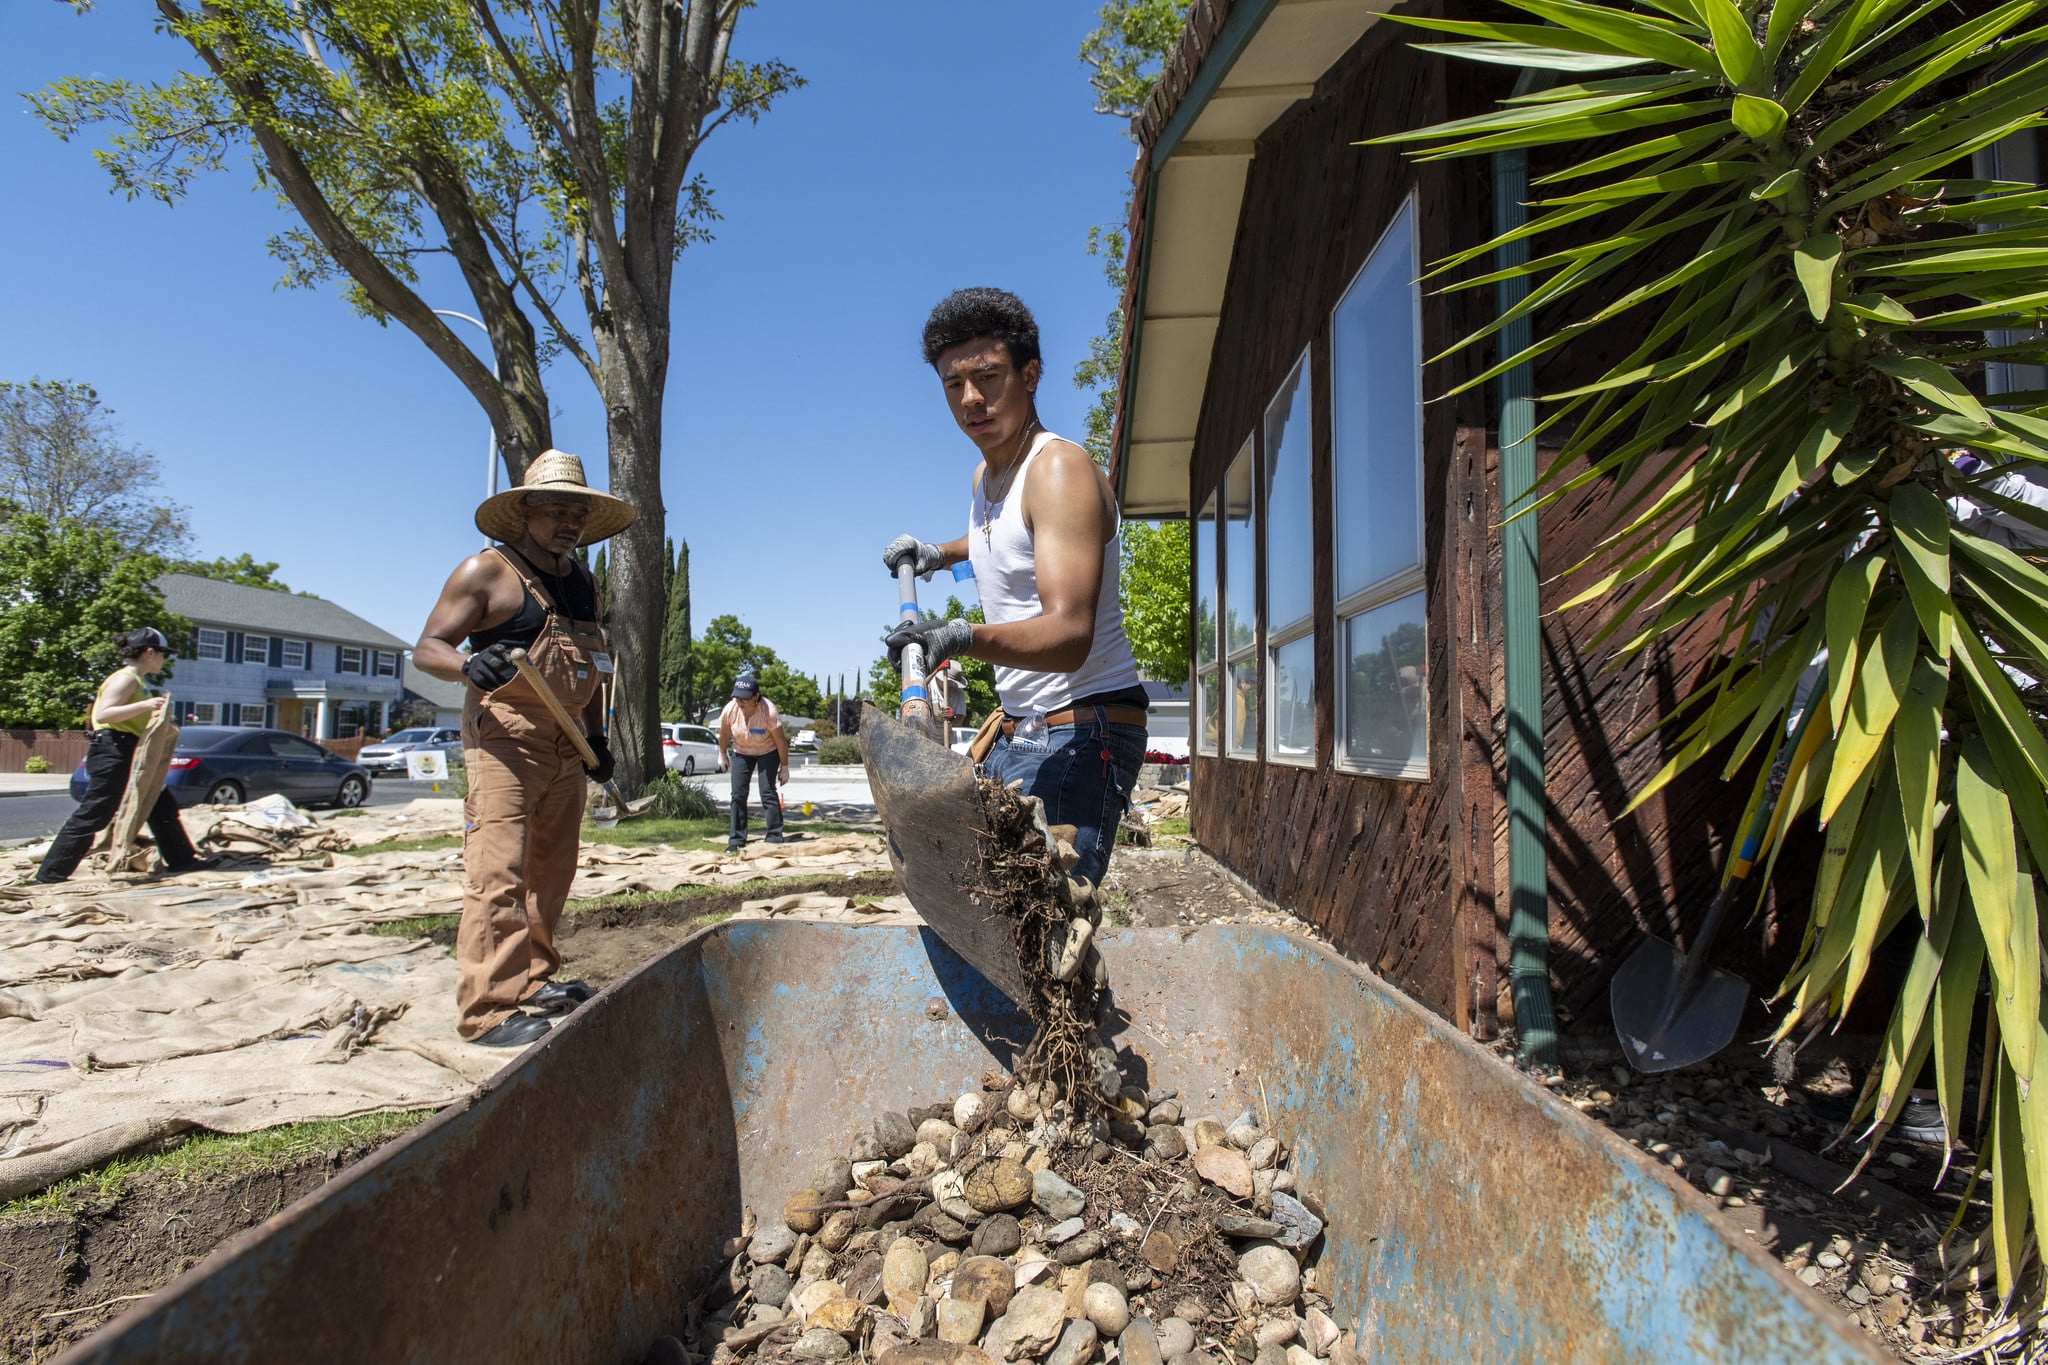
In the five Resilience Hotspots where we are starting our work, we developed strong local partnerships with the organizations and leaders who are vital to driving this work forward over the long term. Through these relationships, we engaged with community stakeholders by conducting interviews, attending public meetings, and holding small group conversations. This allowed the Greenbelt Alliance team to integrate into our research and findings geographically specific knowledge, local expertise, past and ongoing resilience efforts, priorities for adaptation, and shared narratives around the data.
Building strong partnerships with local leaders is vital not only for identifying climate vulnerabilities, but more importantly, for advancing effective, long-term, climate adaptation and resilience work that must be location-appropriate and supported by community leaders in order to move forward. Greenbelt Alliance continues to partner with locally rooted organizations, community leaders, and key stakeholders to develop pathways towards resilience that meet joint goals and priorities. We are committed to advancing next steps that will develop actionable plans and project concepts with community stakeholders, agency implementation partners, and local elected officials at Resilience Hotspots so that we can direct more attention, resources, and climate investments to these special places. Read more about specific Opportunities for Resilience where we are working to lead with nature and invest in the Bay Area’s people in the Community Resilience Profiles.