By James Poetzscher
James Poetzscher is a 17-year-old high school senior at San Francisco University High School. He became interested in air pollution and climate change as a 14-year-old after learning about the dire consequences of these issues and since then has worked on a number of projects in these areas. James’ work has been published in major media outlets including the BBC, Reuters, and The Independent while his research papers are currently in peer review for various respected scientific journals. We are excited to share the following guest blog post by James, where he tells us about the innovative tool he created to help provide accessible and comprehensive air quality information.
As wildfires intensify, temperatures rise, and flood risk increases, Bay Area residents are experiencing the overlapping impacts of climate change in our backyards. During the weeks when skies are hazy and ash dots the sidewalks, everyone discusses the local air quality, debating whether it’s safe to go outside and speculating about how long the crisis will last. Yet, despite the devastating impact of air pollution on California and the U.S. more broadly, I realized there was a severe lack of data for ordinary citizens to learn more about the driving forces behind the air quality crisis. So, I set out to build an air pollution and greenhouse gas data portal to address this issue.
A Comprehensive Air Quality Data Portal
I built a comprehensive air quality data portal featuring data on various air pollutants and greenhouse gases (GHGs). Other air quality data portals, which are limited in that they use ground sensor data as opposed to satellite data, don’t allow for spatial or temporal averaging, and often don’t distinguish between the various species of air pollutants and greenhouse gases. My portal uses data from the Sentinel-5P satellite, ensuring that it features full nationwide air quality data instead of sparsely distributed data only available where ground sensors are located. It also allows for visualization of each air pollutant or greenhouse gas individually, enabling users to learn more about the distribution of the various air pollutants and their respective contributions to air quality. Most importantly, however, is the portal’s ability to average air pollutant or greenhouse gas data over any region and over any period of time.
Curious about how significantly nitrogen dioxide (NO2) levels declined in San Jose due to COVID-19 lockdowns? Simply view the average NO2 level in San Jose during a period prior to lockdown and during lockdown. Interested in how wildfires influenced carbon monoxide levels in San Francisco in 2020? Compare carbon monoxide levels between August 1st to August 15th (prior to wildfires) to carbon monoxide levels between August 16th to August 31st (peak wildfire period). Through averaging data over time, users can understand how air pollution differs from region to region and how concentrations of the various air pollutants and greenhouse gases shift over time, especially in relation to events such as wildfires and the COVID-19 lockdowns.
Air pollution is a crucial issue, responsible for 8.7 million deaths annually. The hope is that my data portal helps ordinary people learn more about air pollution and discover how it impacts their community.
Air pollution is not an isolated issue. The more we know about its effects, the more we can take action through building more infill housing and transit oriented development, reducing our GHG emitting commutes, and building healthy, resilient communities. Low-income and communities of color are already disproportionately affected by the impacts of climate change, and the compounding effects of poor air quality and gentrification make it even more challenging to live in the Bay Area. It aggravates other issues like poverty, food insecurity, and racial inequality. By addressing air pollution, we can also curb these correlated issues.
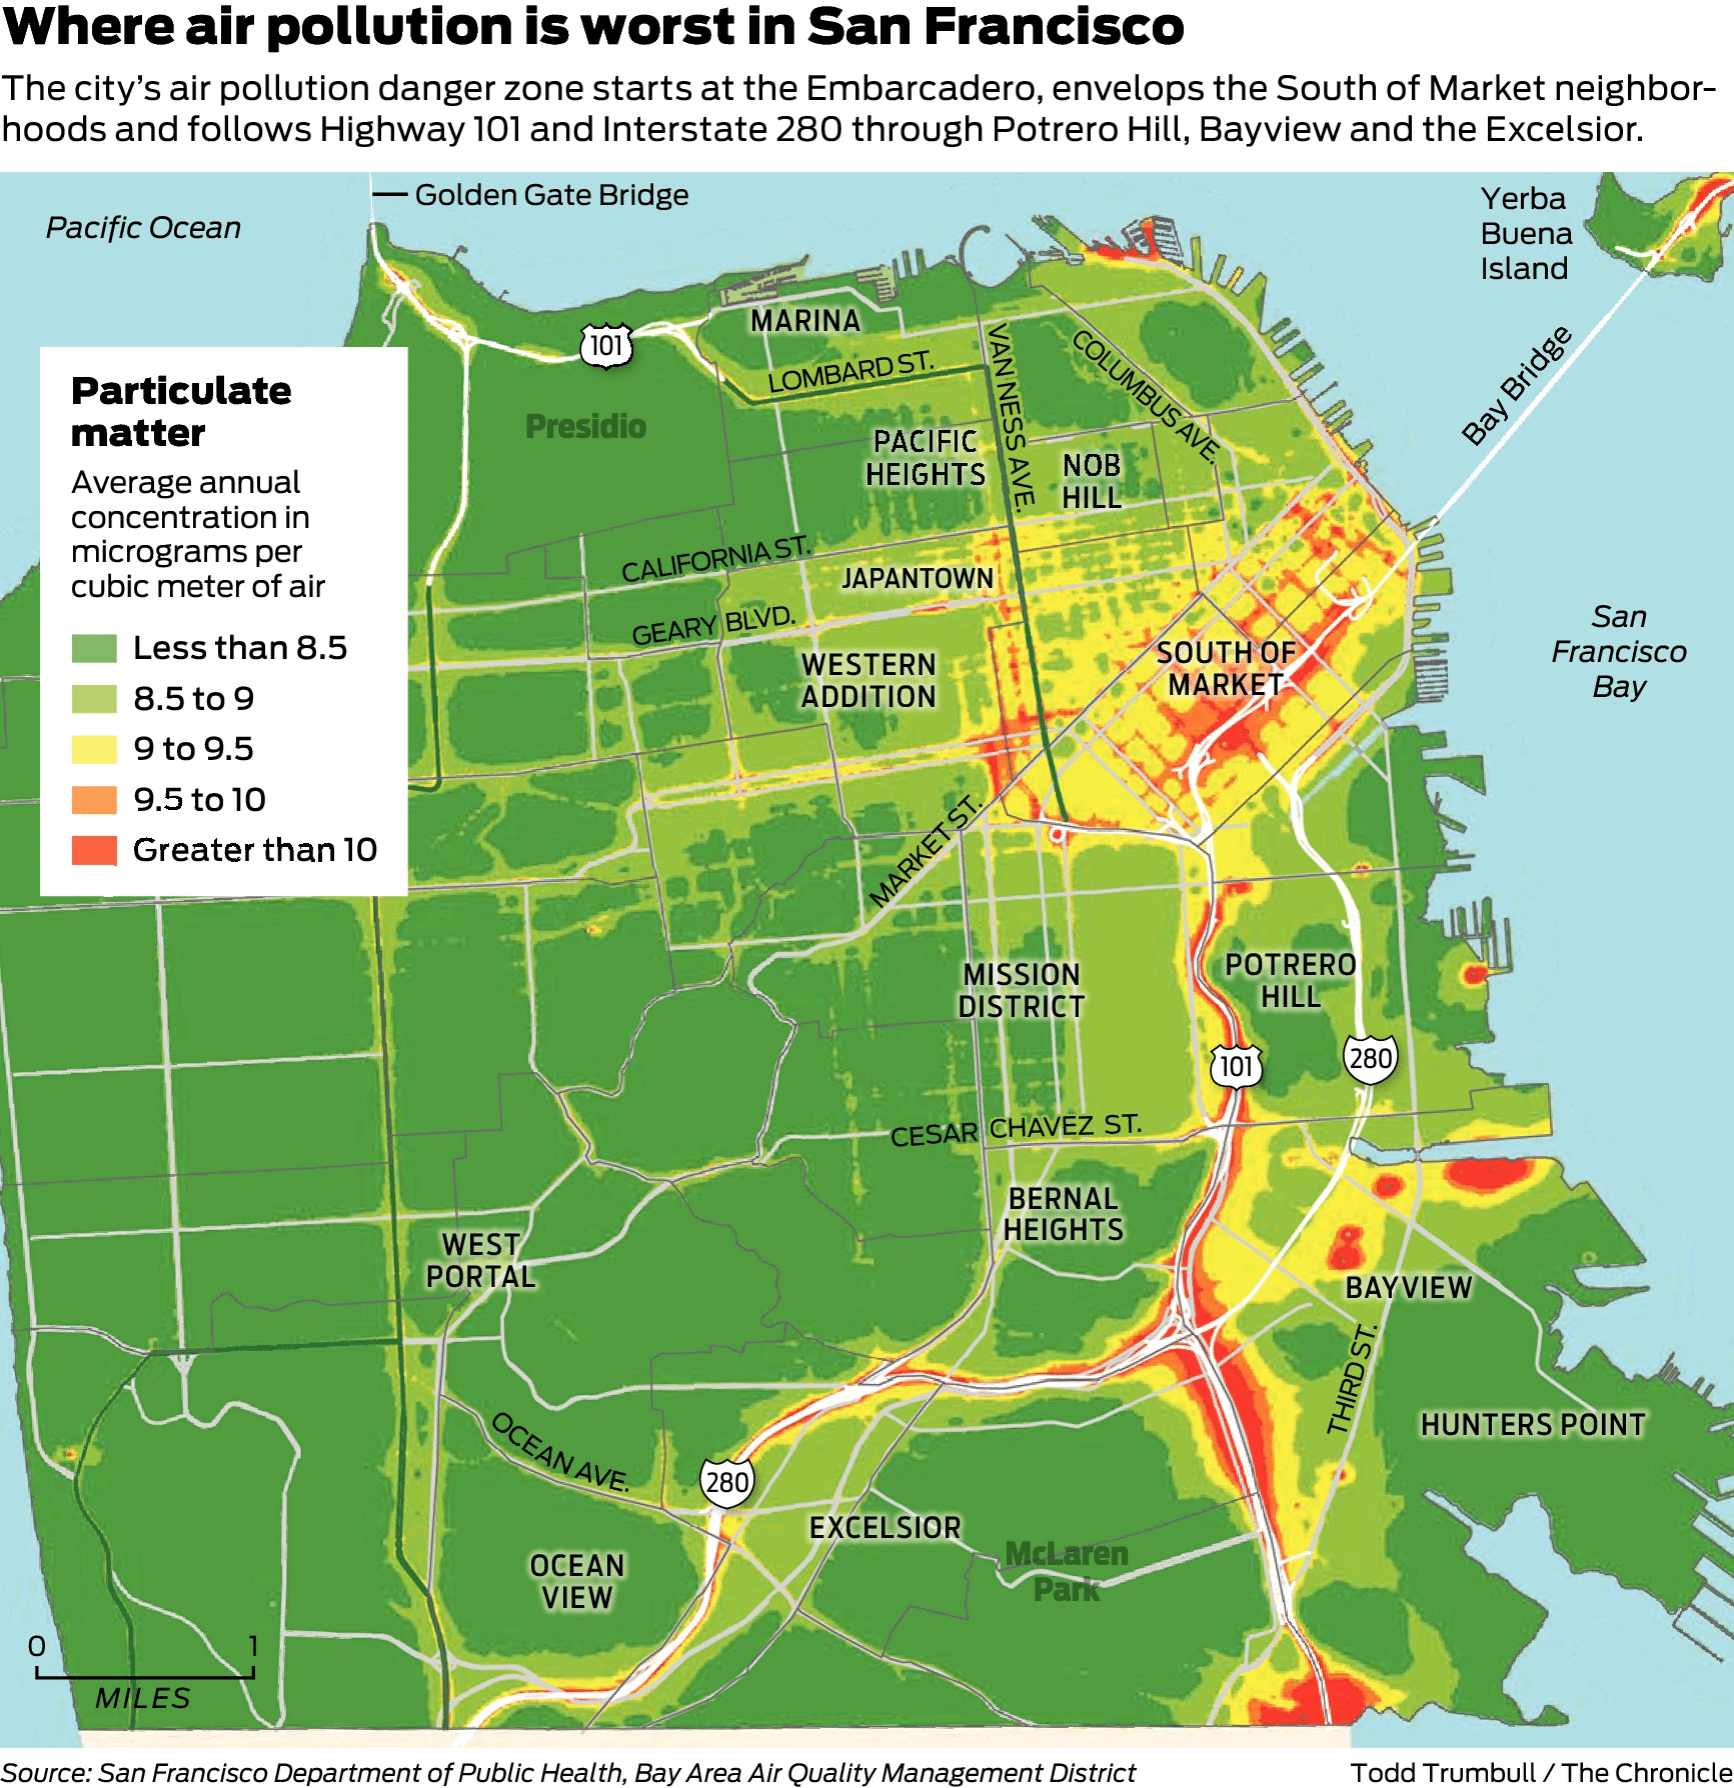
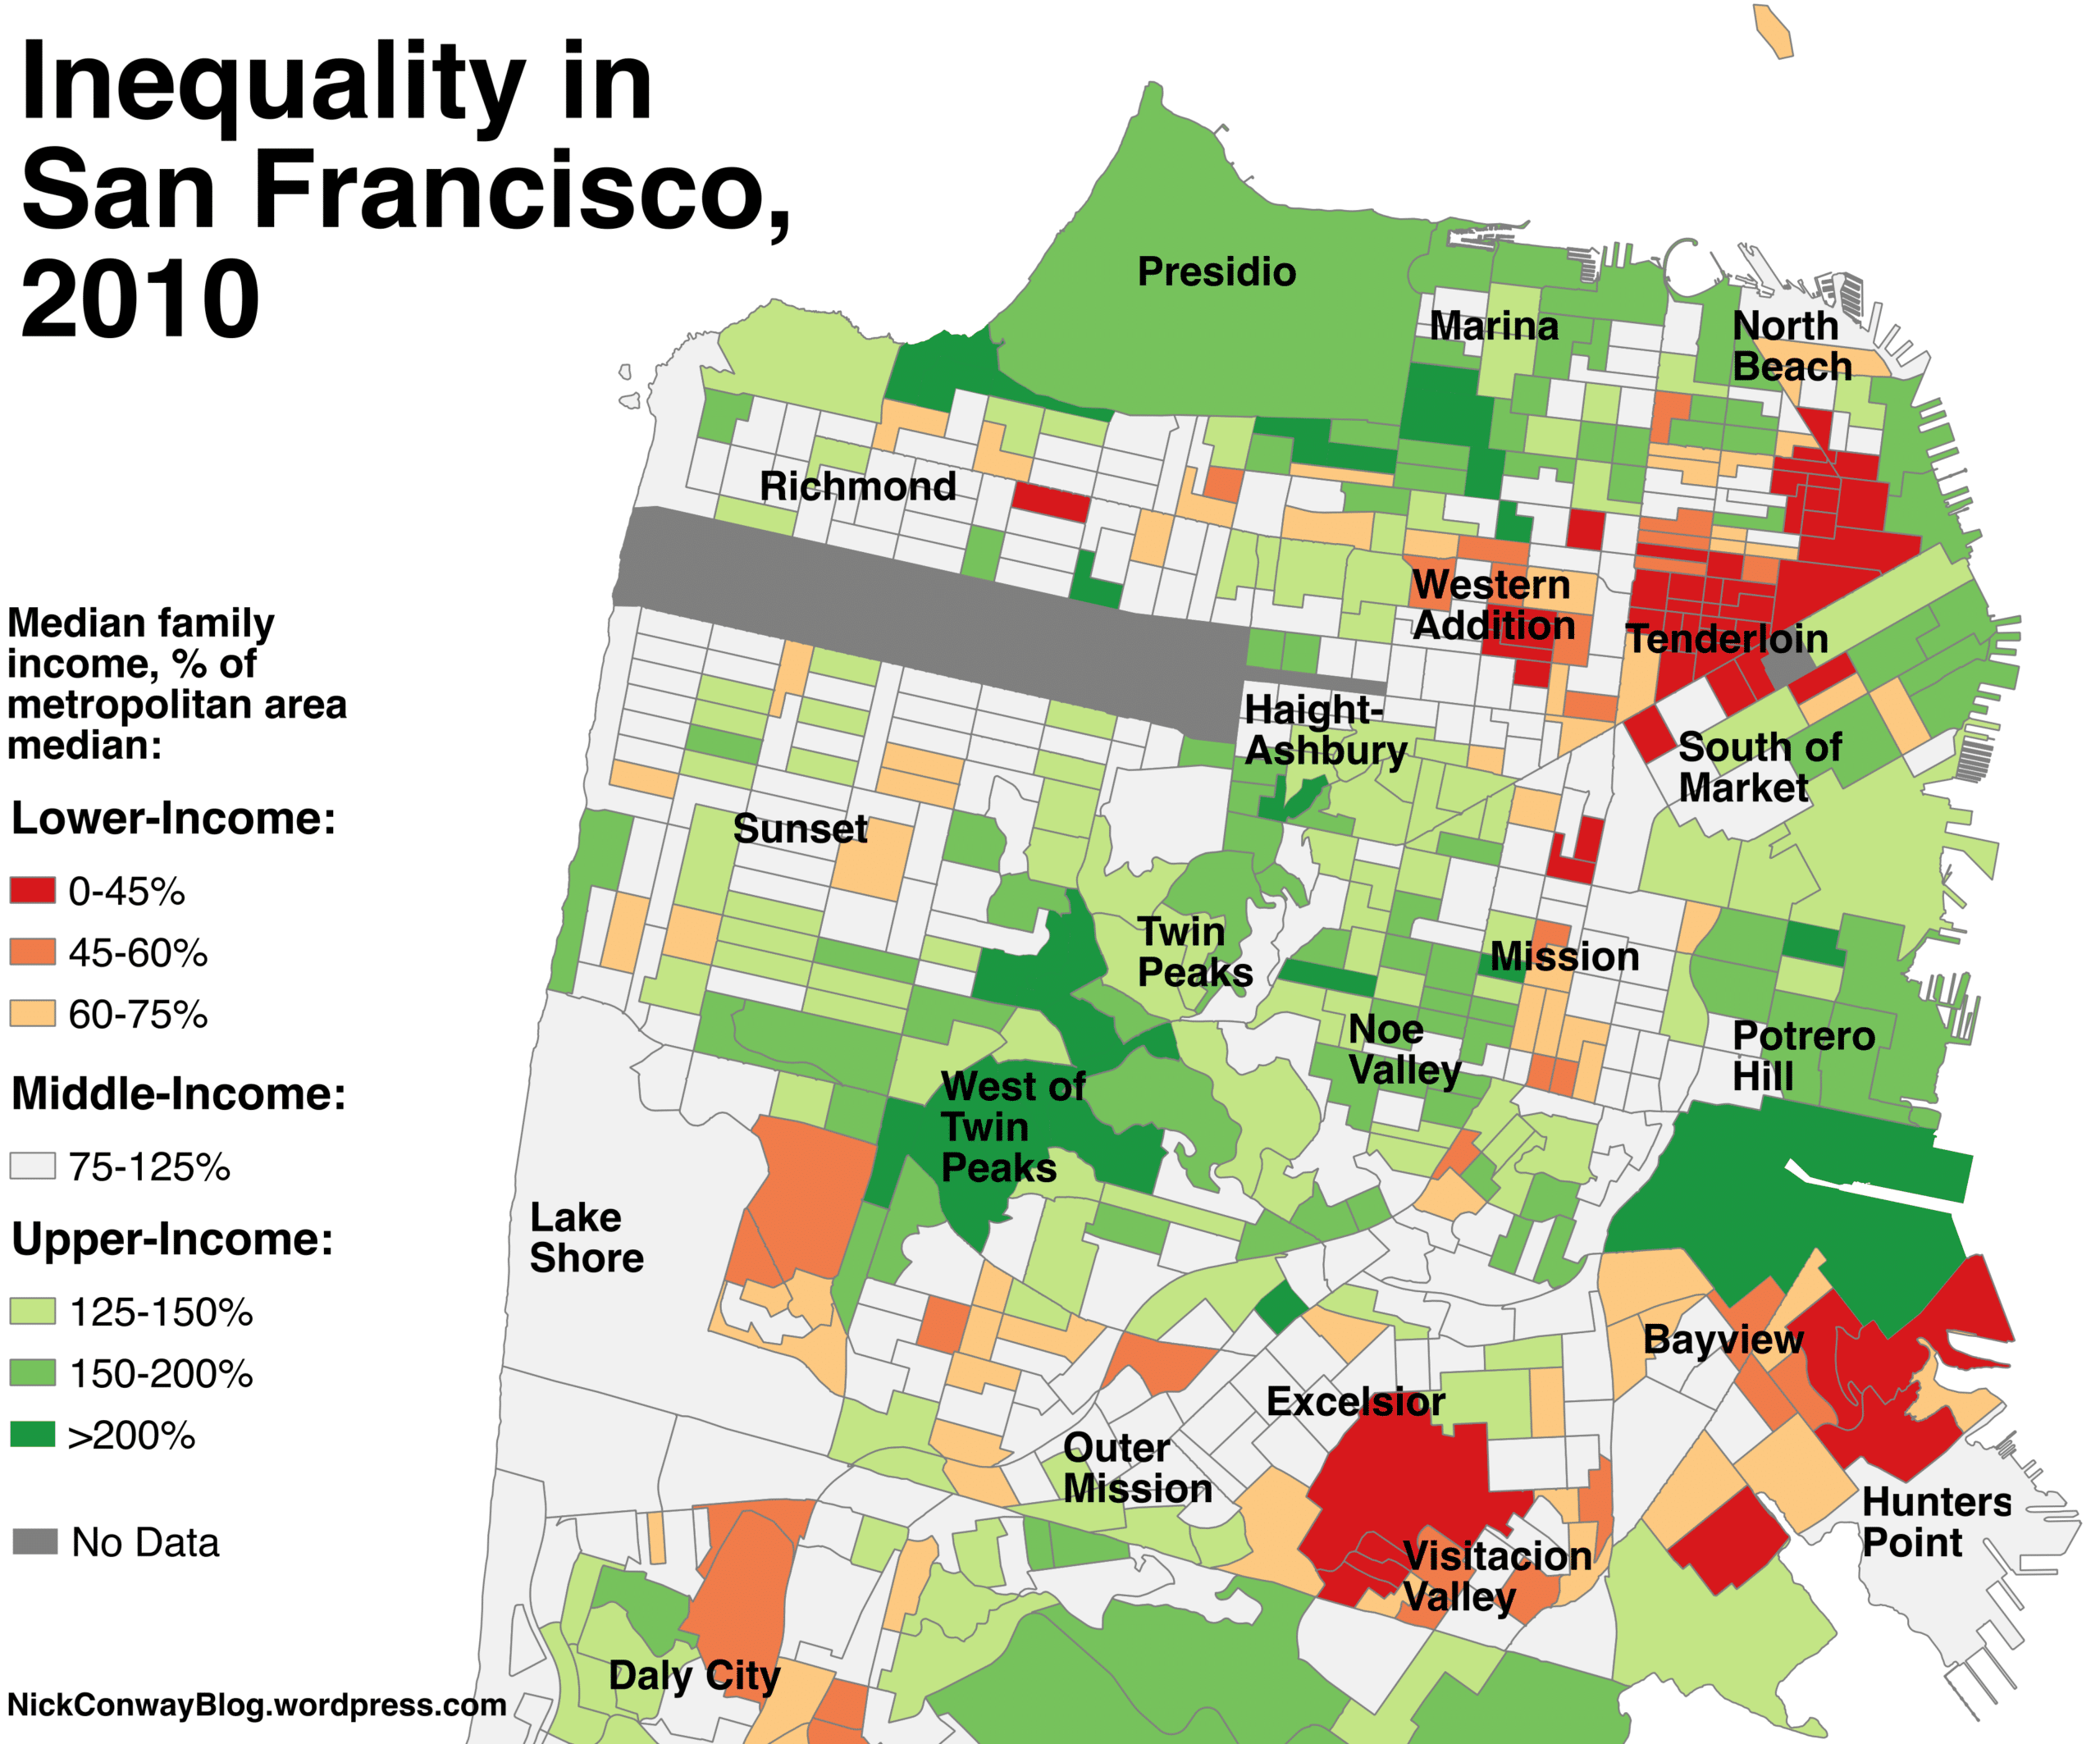
San Francisco is a prime example of how poor air quality overlaps with low-income communities. The image on the left illustrates air pollution in San Francisco, while the image on the right depicts average income throughout the city. The connection is clear. San Francisco neighborhoods most impacted by severe air pollution are the Western Addition, the Tenderloin, SOMA, Bayview, and Visitacion Valley. These neighborhoods all have median family incomes well below the metropolitan median (except for certain parts of SOMA). The correlation between air pollution and poverty is unsurprising, especially in a major metropolitan area like San Francisco. Road transportation is a crucial contributor to air pollution and is the primary contributor to nitrogen dioxide and particulate matter—two of the most critical and well-researched pollutants. Therefore, highways and major city streets, which typically experience the largest volume of road transport in an urban area, are often home to severe air pollution.
Housing near highways also tends to be far cheaper than the city average and is often the only affordable option for people of lower socioeconomic status. Unfortunately, this leads to people of lower socioeconomic status being disproportionately impacted by air pollution, which also aggravates poverty. Air pollution can induce severe health consequences that require significant time and money to address. Likewise, air pollution significantly reduces productivity and decreases the overall quality of life. These consequences mean that the disproportionate exposure to air pollution that people of lower socioeconomic status suffer from makes getting out of poverty significantly more difficult.
We can tackle air pollution by building climate SMART housing to reduce GHG emissions and create healthy, safe, resilient communities. By tackling air pollution, we can prevent nearly 9 million premature deaths every year (around 18% of total annual deaths) and alleviate related issues such as poverty, racial inequality, and food insecurity. The first step in addressing air pollution is understanding the problem on a local level: discovering how air pollution impacts your local neighborhood. The best place to begin your exploration of air pollution is with my data portal, which you can check out today by clicking here.
Header Photo: Ian Simmonds via Unsplash